TraceLab: Characterizing Coding Agent Workloads for LLM Serving
Kan Zhu, Mathew Jacob, Chenxi Ma, Yi Pan, Stephanie Wang, Arvind Krishnamurthy, Baris Kasikci
New ResearchInference & ServingAgents
June 25, 2026
Overview
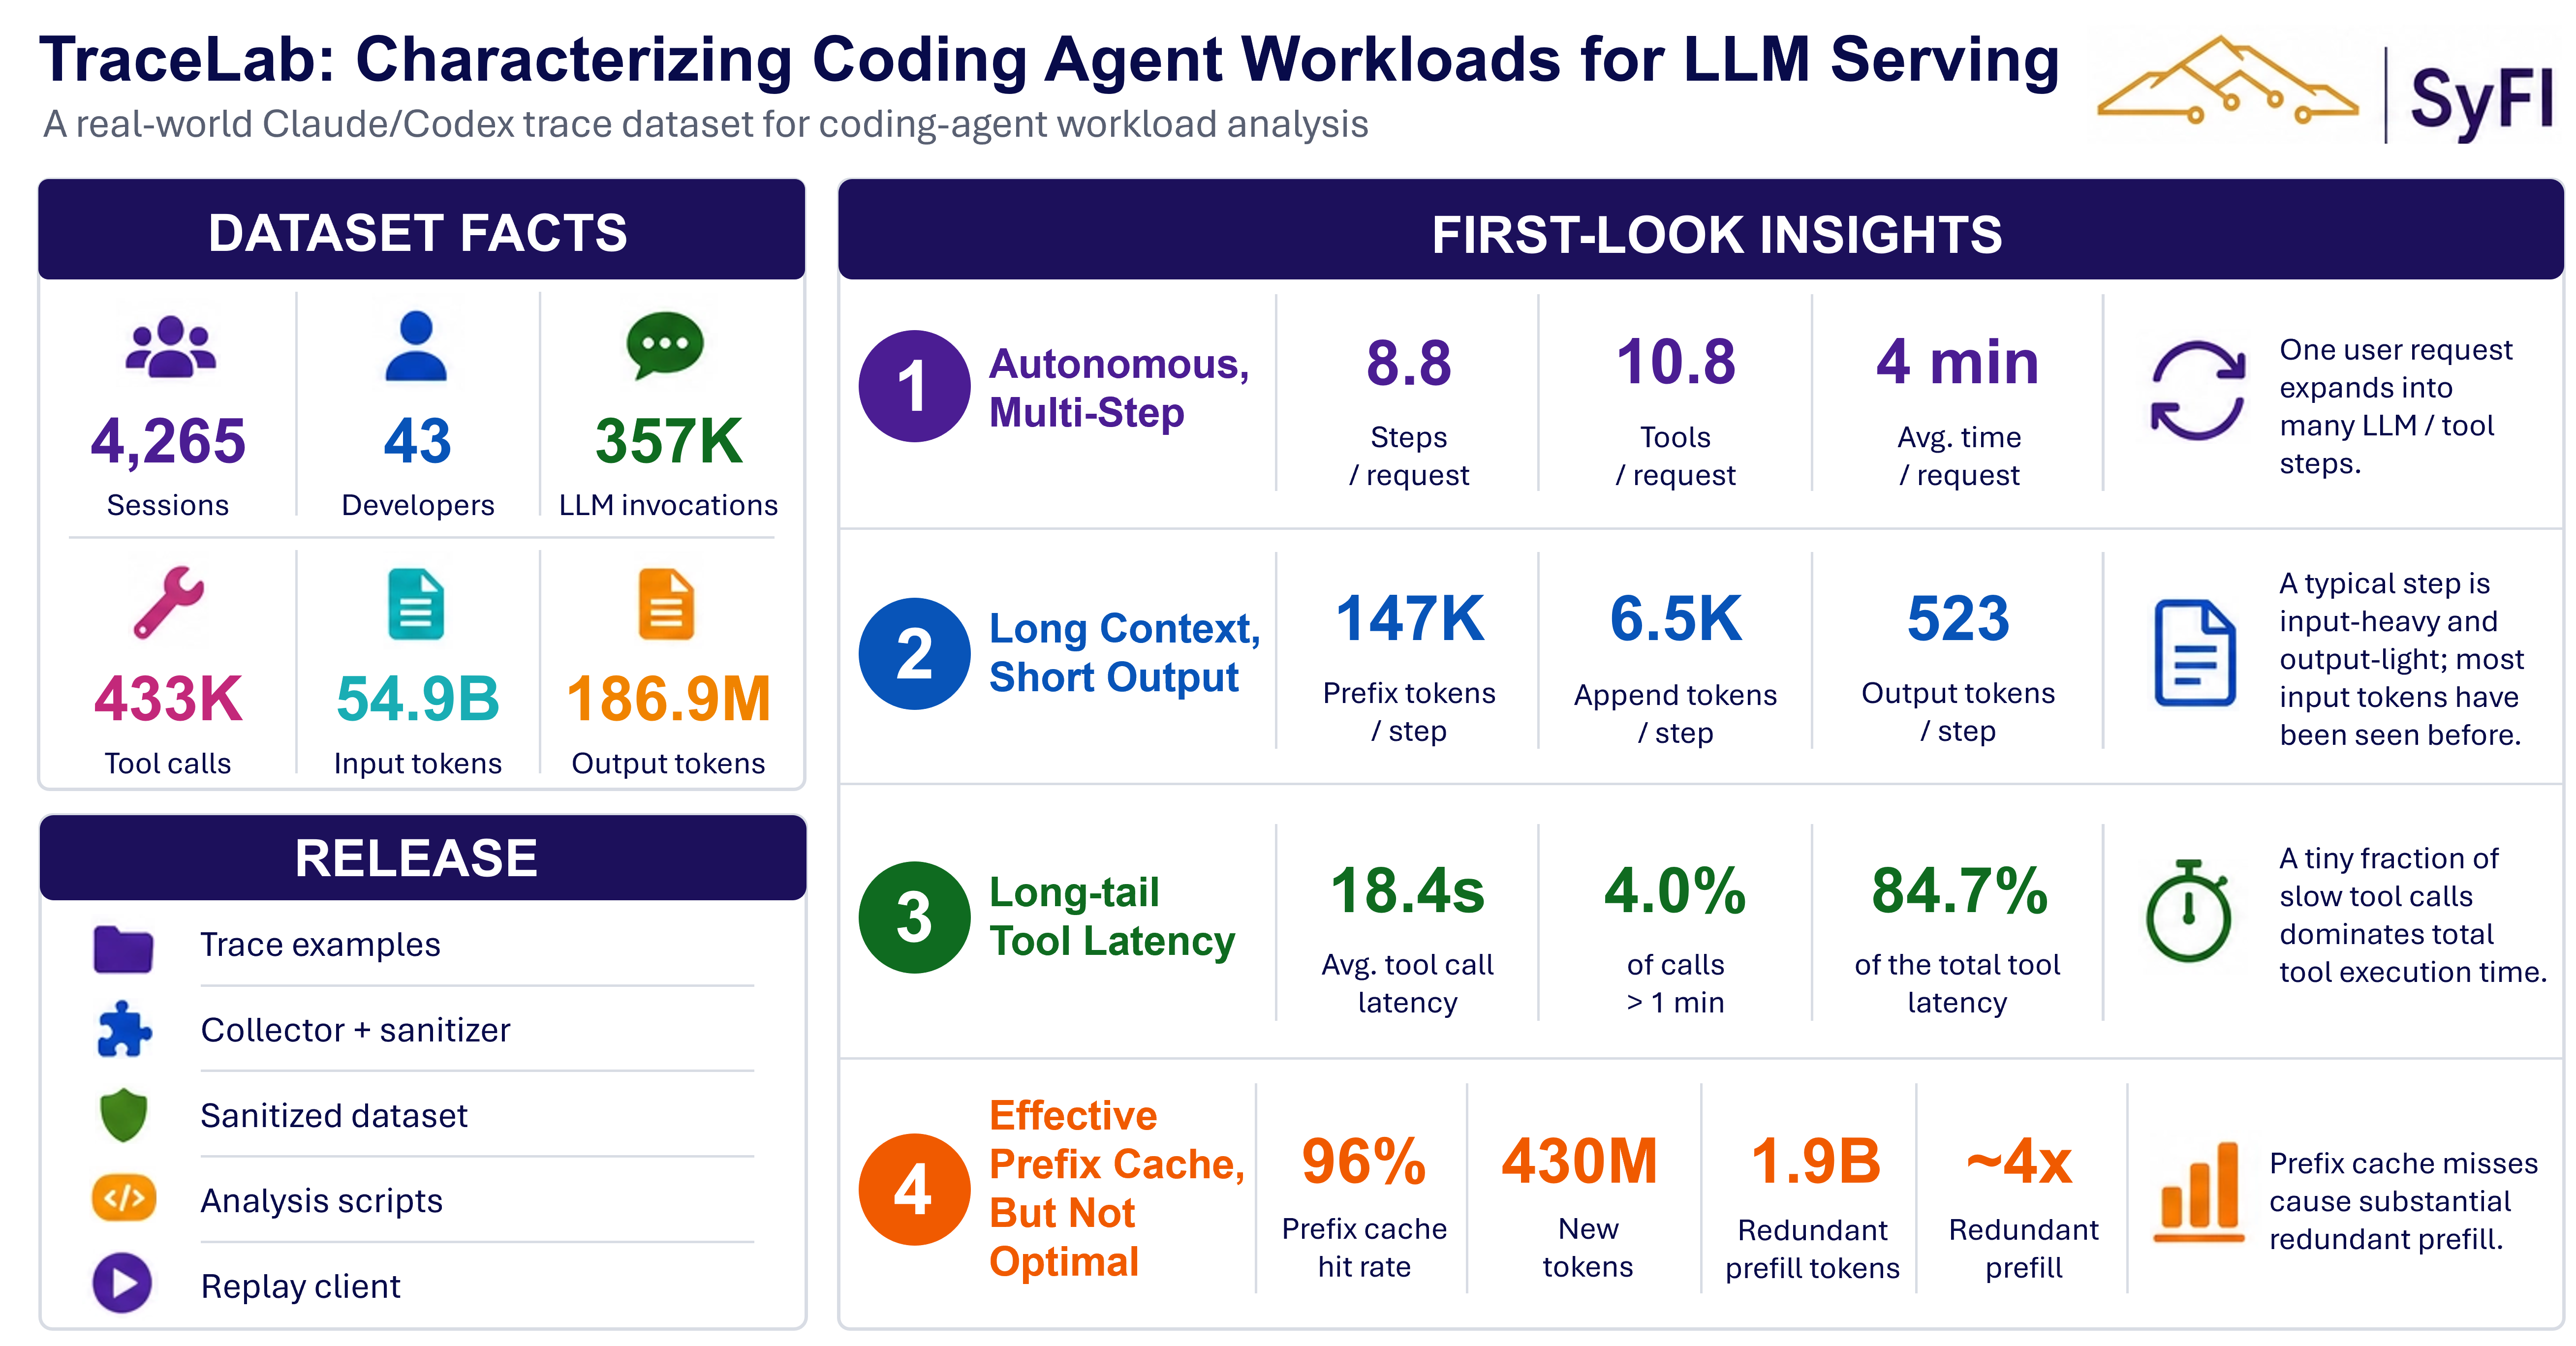
As major AI labs ship their own coding agents—Claude Code from Anthropic, Codex from OpenAI, and Gemini CLI from Google—serving these agents efficiently is an increasingly important systems problem. Existing model-quality benchmarks, such as Terminal-Bench and SWE-bench, are poorly suited to modeling serving-system performance; they involve relatively few tool calls and focus on single, isolated tasks.
To close this gap, we are releasing the SyFI coding trace—a real-world dataset collected from our group’s everyday coding-agent usage—to guide the design of serving systems for coding agents. We are also open-sourcing the trace collection and analysis pipeline, TraceLab, making it easy to generate personalized traces and contribute them back to the dataset. The trace and code are available at https://github.com/uw-syfi/TraceLab, and a live demo at https://tracelab.cs.washington.edu/.
Trace Collection and Trace Facts
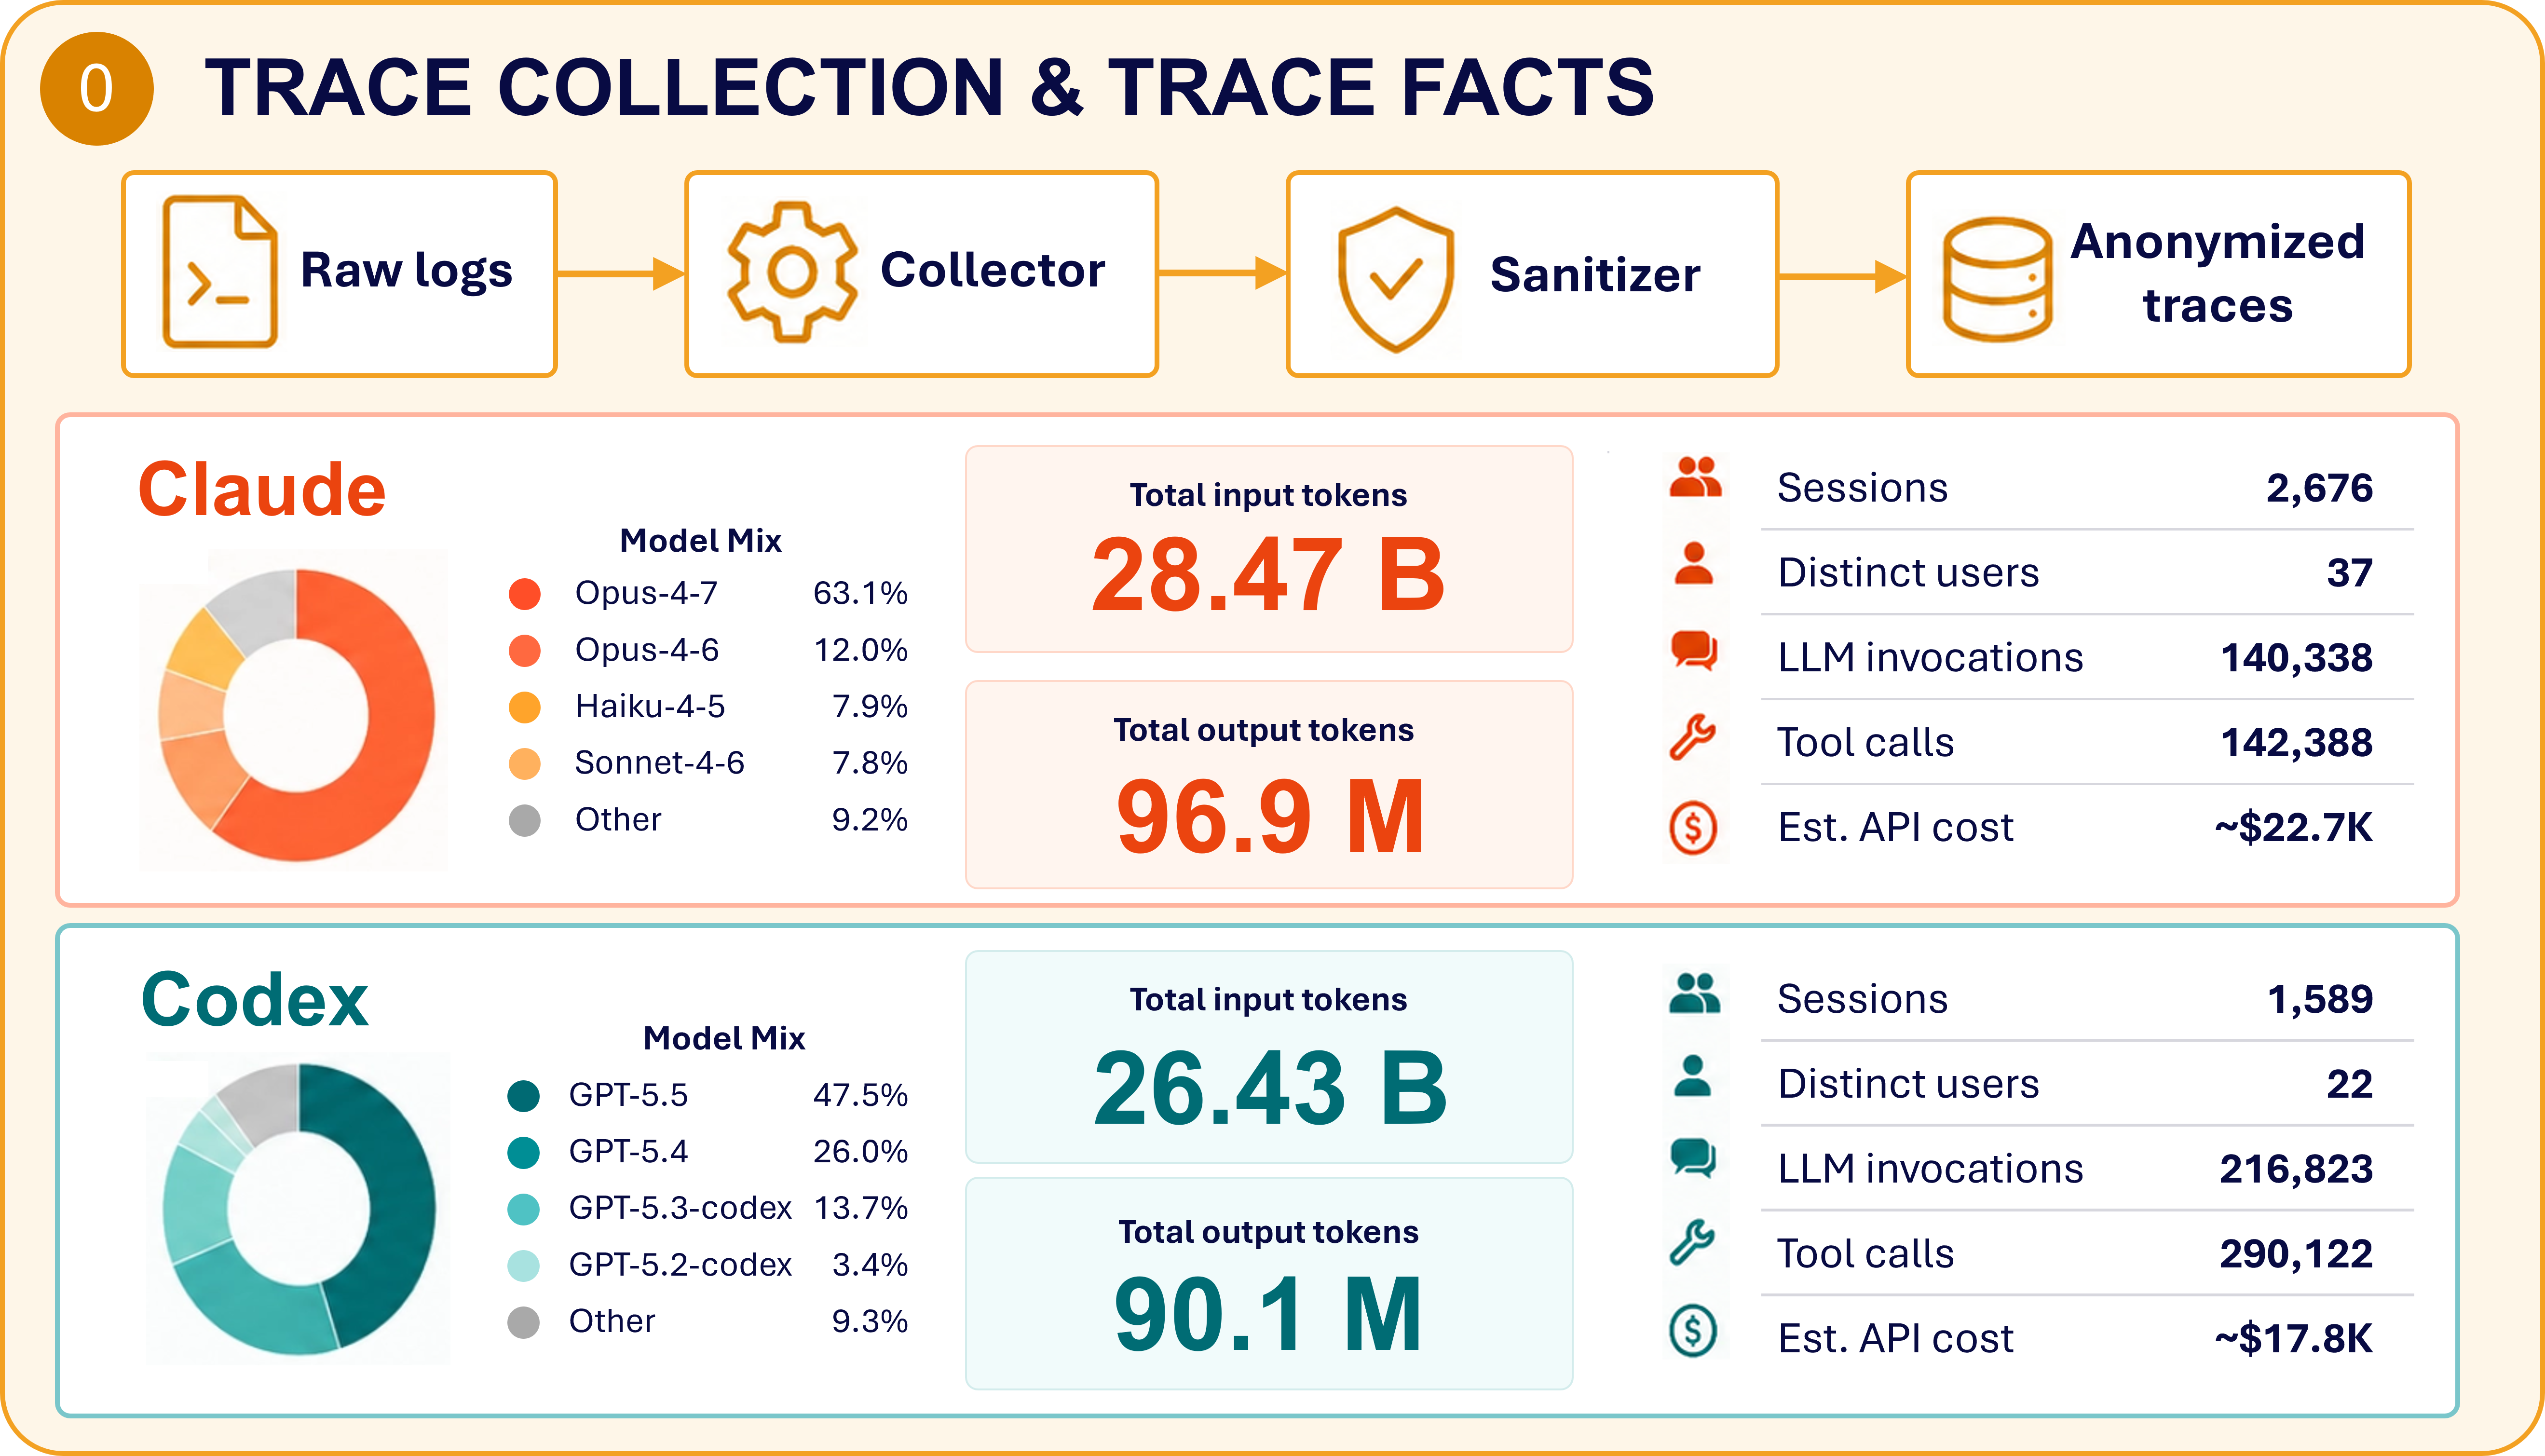
We collect these traces from our own daily use of Claude Code and Codex doing research and development in the SyFI lab. The pipeline runs in two stages. First, a trace collector reads the raw, verbose session logs, extracts the key fields, and discards the surrounding logging scaffolding. Then, a trace sanitizer strips sensitive content—such as tool-call inputs and outputs—and anonymizes the rest by removing usernames and mangling session IDs. The resulting anonymized trace, at a scale of ~4,300 sessions and 55B tokens in total, is large enough for a serving engine or even a distributed serving fleet to reach steady state.
Observations
We summarize our major observations and provide suggestions for future systems research for better supporting agentic coding use cases.
1- Autonomous, Multi-Step Conversation
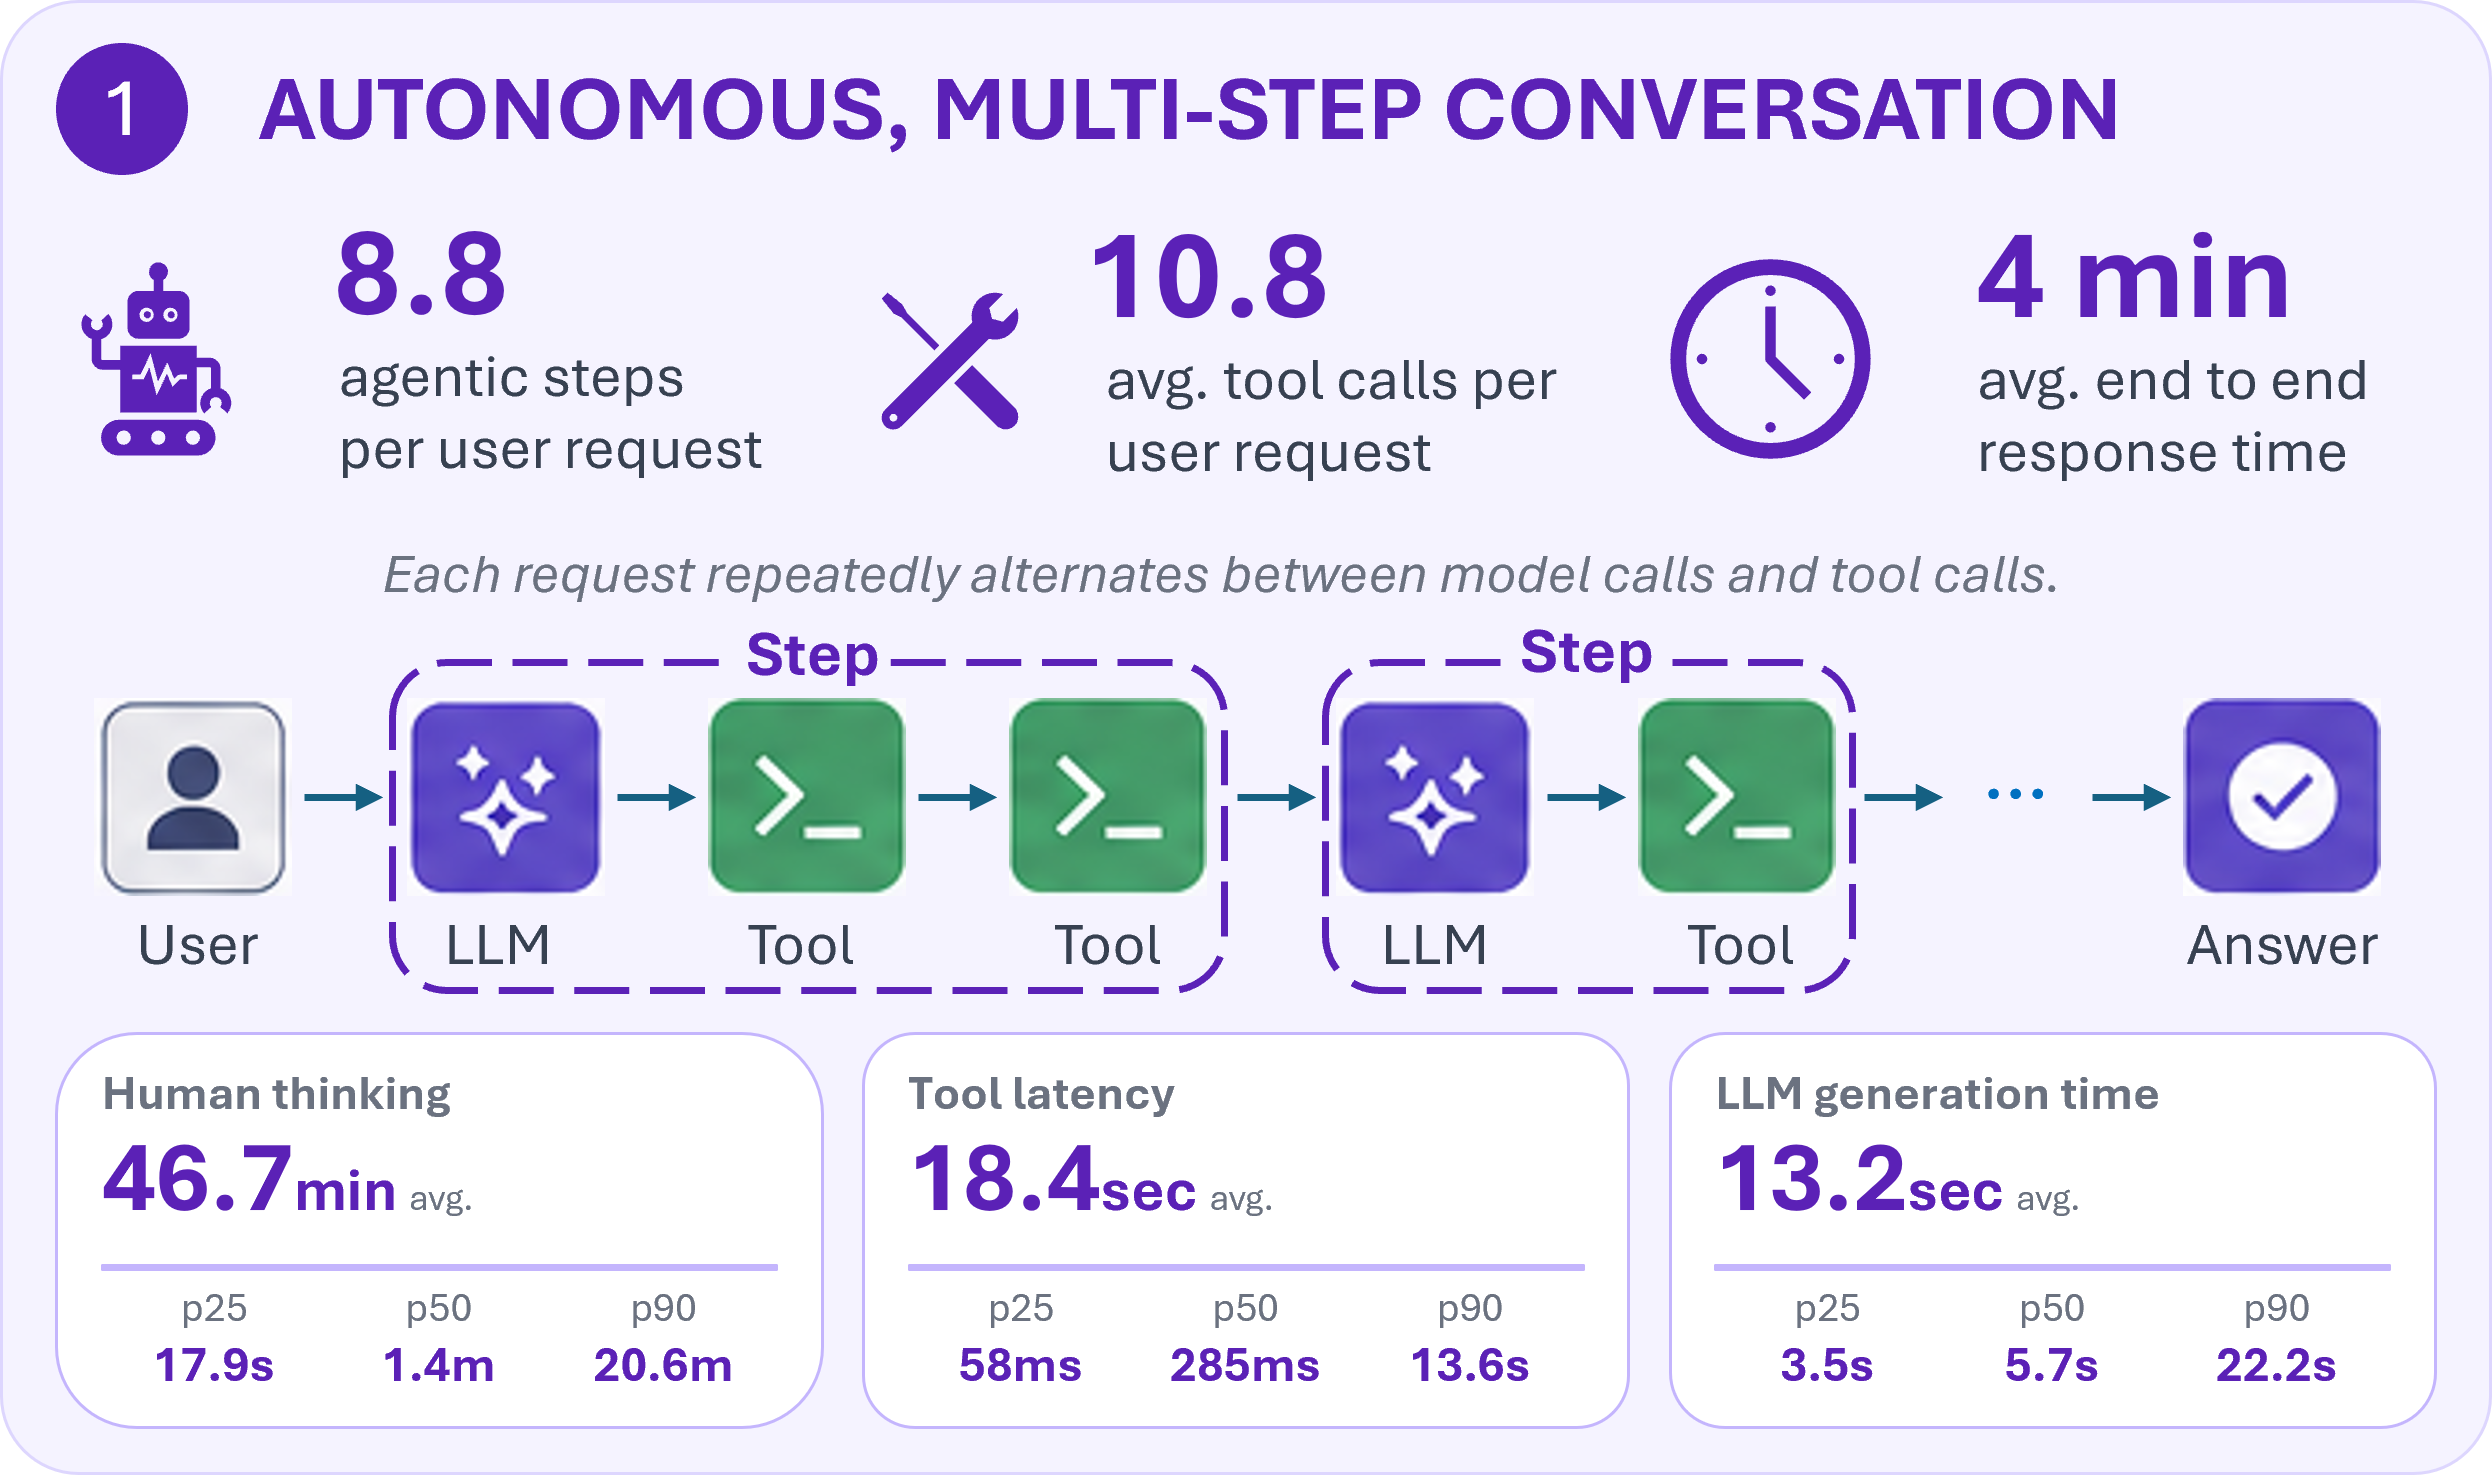
Coding agents do not answer in one shot. For each user request, the agent executes an autonomous loop of model generations and tool calls before returning a final answer. In our traces, each request takes an average of 8.8 self-directed steps, i.e., LLM-tools cycles, and issues 10.8 tool calls before giving the final answer. As a result, 88% of all LLM rounds respond to a tool result rather than a human.
The time spent within this autonomy is distributed unevenly across the loop. A single LLM generation averages ~13 s and each tool call ~18 s. End-to-end response time per request is heavy-tailed: the median is ~38 s, but the mean is ~4 min and the p99 is nearly 44 min. The largest gap, however, is between requests: the user spends time reading the output, thinking, and typing the next request, which takes an average of 46.7 min, despite a median of ~1.4 min.
Potential Research Directions.
- Increasing the number of tool calls issued per round while holding the total count roughly fixed, thereby reducing the number of steps and increasing the opportunity for parallel tool execution
- Using early signals that the user is about to start the next turn—the user re-activating the terminal window or beginning to type—to prefetch and re-prefill the conversation history during the long idle gaps between turns.
2- Long-Context, Short-Output Generation
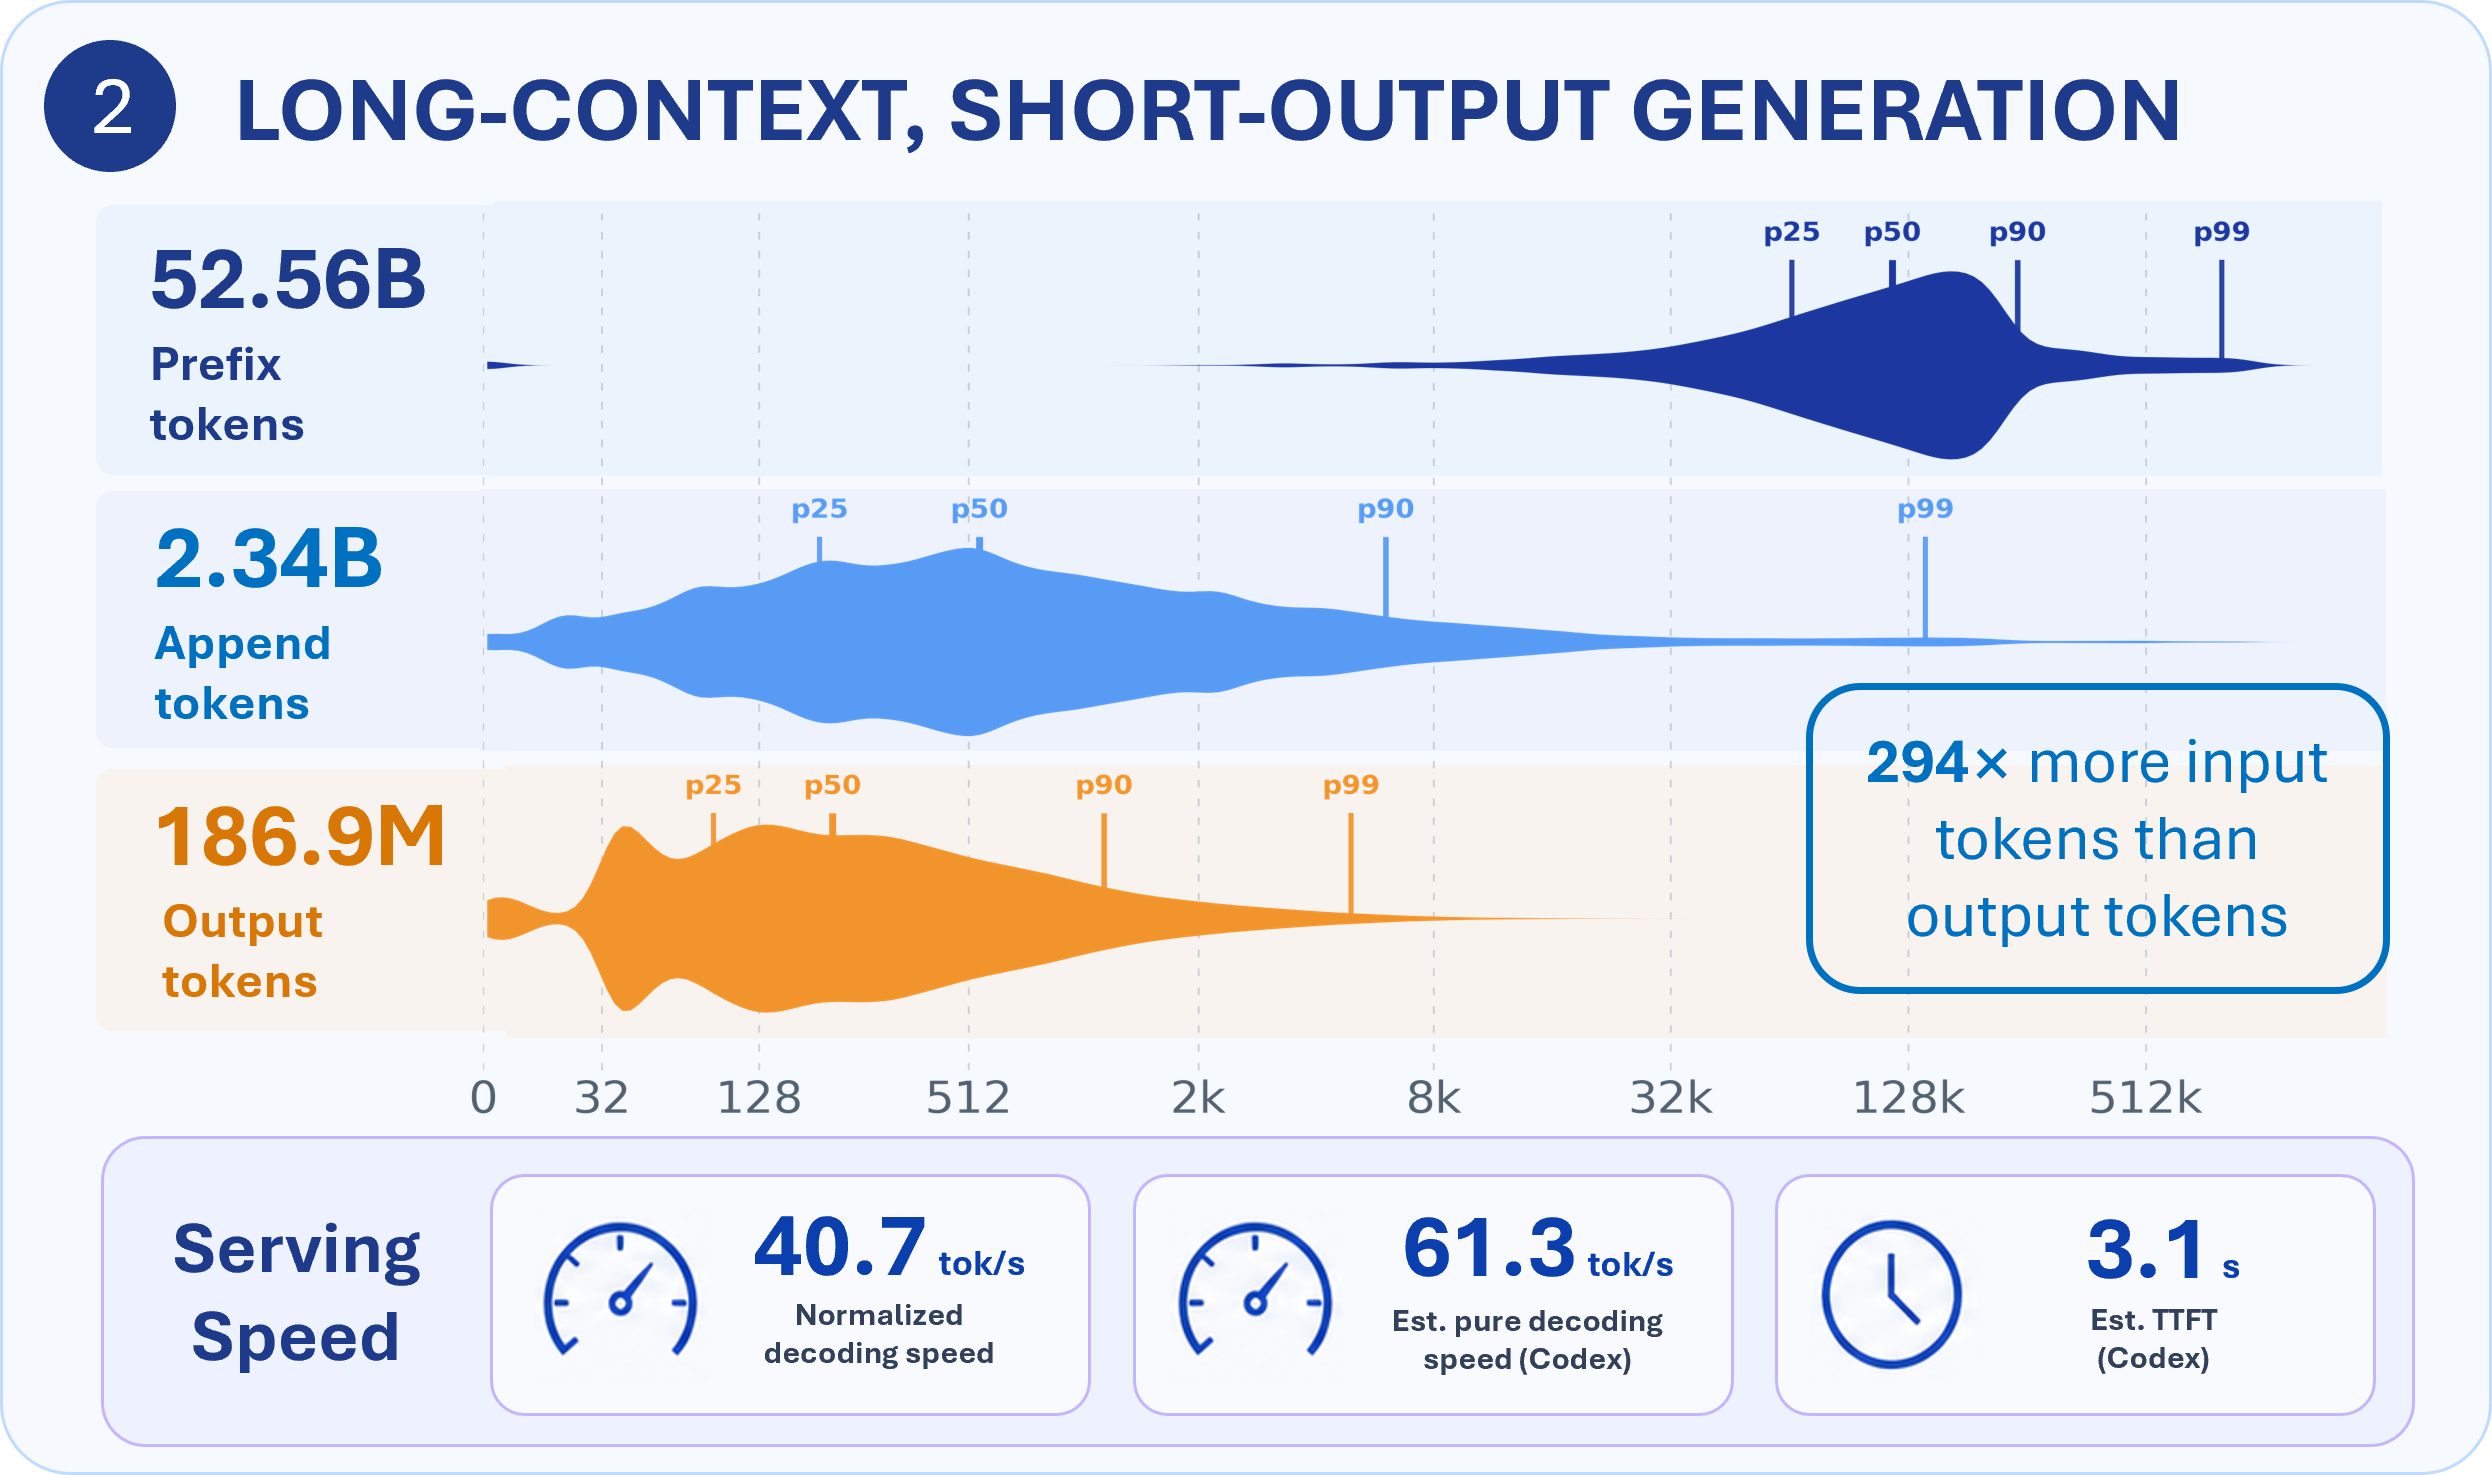
Each round carries a very large prompt but generates comparatively little output. Across the trace, models read 52.56 B cached input tokens and prefill 2.34 B new ones, yet generate just 186.9 M output tokens—inputs outnumber outputs by 294×. A typical round sits on a 32k–256k-token prefix, appends only a few hundred to a few thousand tokens, and decodes a couple hundred out. However, the tail of new input tokens can go over 128K.
Speed-wise, the normalized decoding speed has a median of ~40.7 tok/s overall (Claude 46.8, Codex 33.9), and Codex’s pure-decoding rate reaches ~61.3 tok/s. Codex’s TTFT for each step (~3.1 s) is roughly 25% of a round’s generation time.
Potential Research Directions.
- Short, incremental prefills need to be handled differently from those long prefills due to their distinct performance characteristics.
- The per-step TTFT of returning from a tool result back into the next generation must be reduced through better request routing and auto-scaling policies for a shorter end-to-end time.
3- Tool-Heavy, Long-Tailed Execution
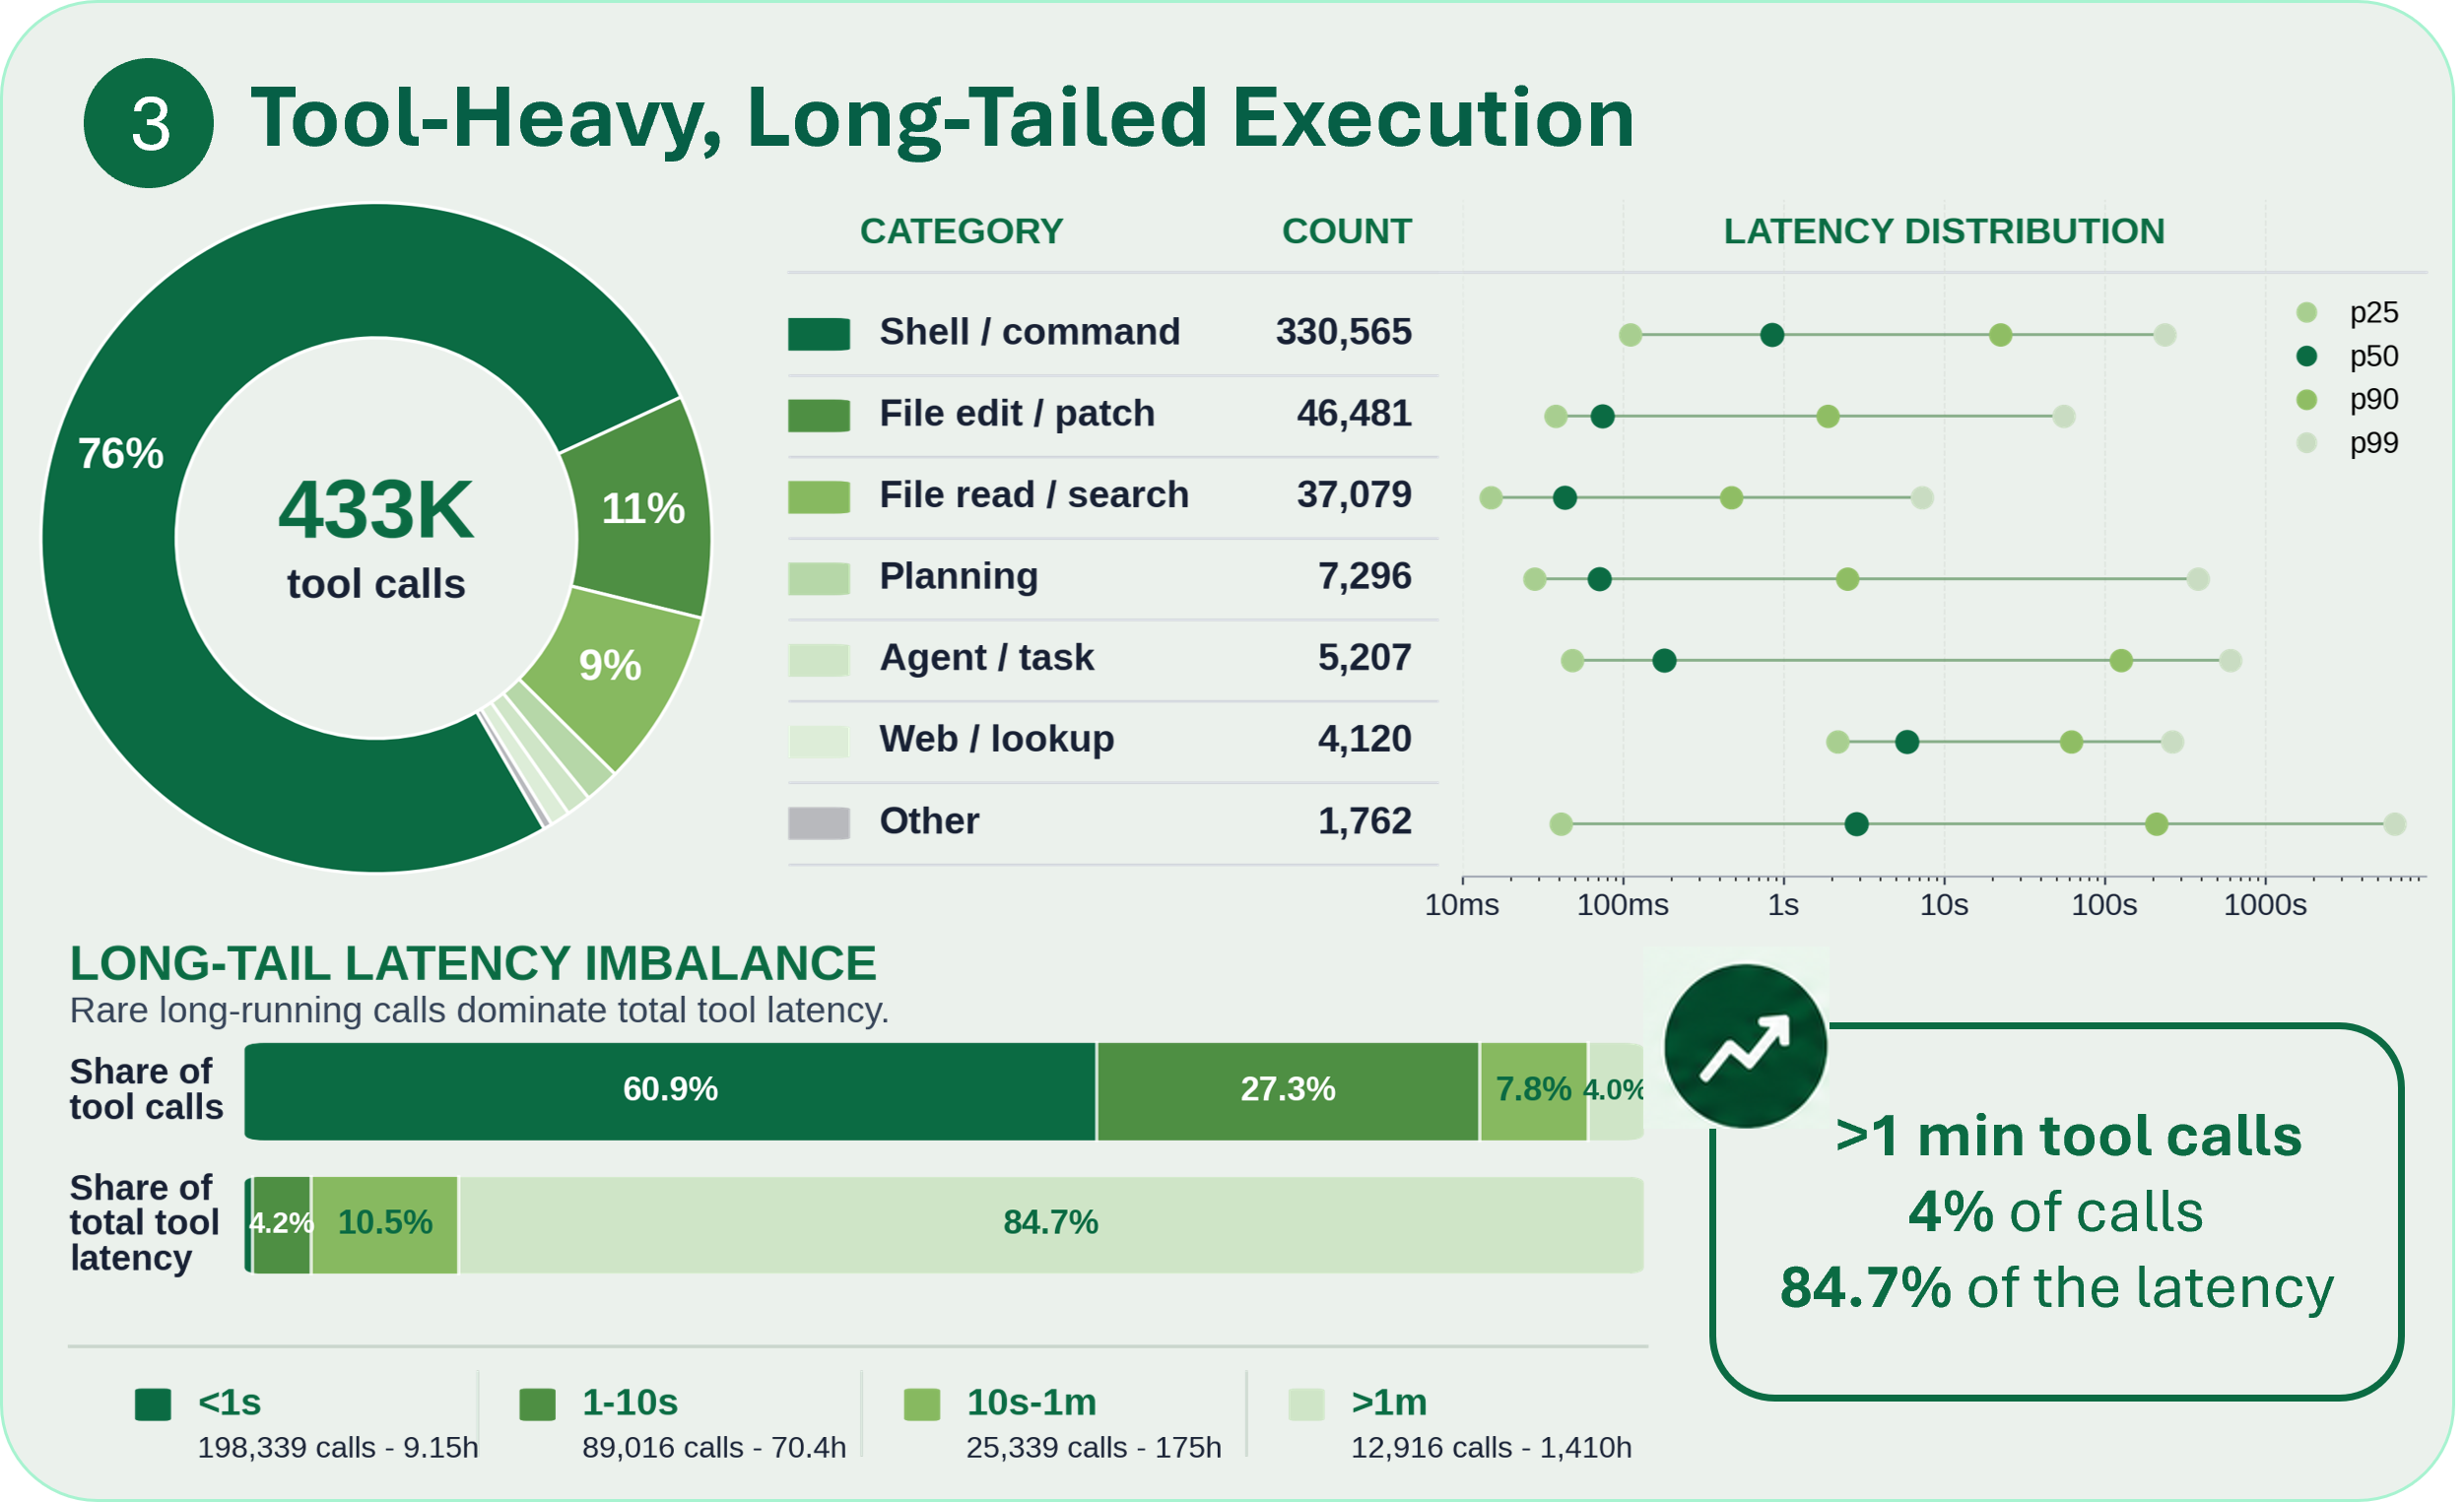
The autonomous LLM-tools-LLM loop runs almost entirely on a small set of tools, and those tool calls are dominated by the shell. Of 433 K tool calls, 76% are shell/command executions (running builds, tests, git, and similar commands), followed by file edits (11%) and file reads/searches (9%); planning, sub-agent, and web-lookup calls make up the rest. Claude draws on a far wider tool vocabulary (54 tools) than Codex (31), but both concentrate most of their volume in the same few—chiefly shell commands, file edits, and file reads/searches.
Tool latency is heavy-tailed both across tool types and within individual types, a tool like Bash spans four-plus orders of magnitude. The imbalance is stark: calls under 1 s are ~61% of all calls but only ~1% of total tool time, while the ~4% of calls lasting over a minute consume ~85% of it.
Potential Research Directions.
- Tool-call latency prediction, used for estimating KV-cache reuse distance, should consider the tool’s input arguments and execution history rather than its category alone. For example, the same
Bashcall ranges from a sub-secondgit checkoutto a multi-minute compile. Some of our explorations in this direction appear in CacheWise, which studies reuse-aware KV-cache management for coding-agent workloads.
4- Prefix Cache Effective But Not Optimal
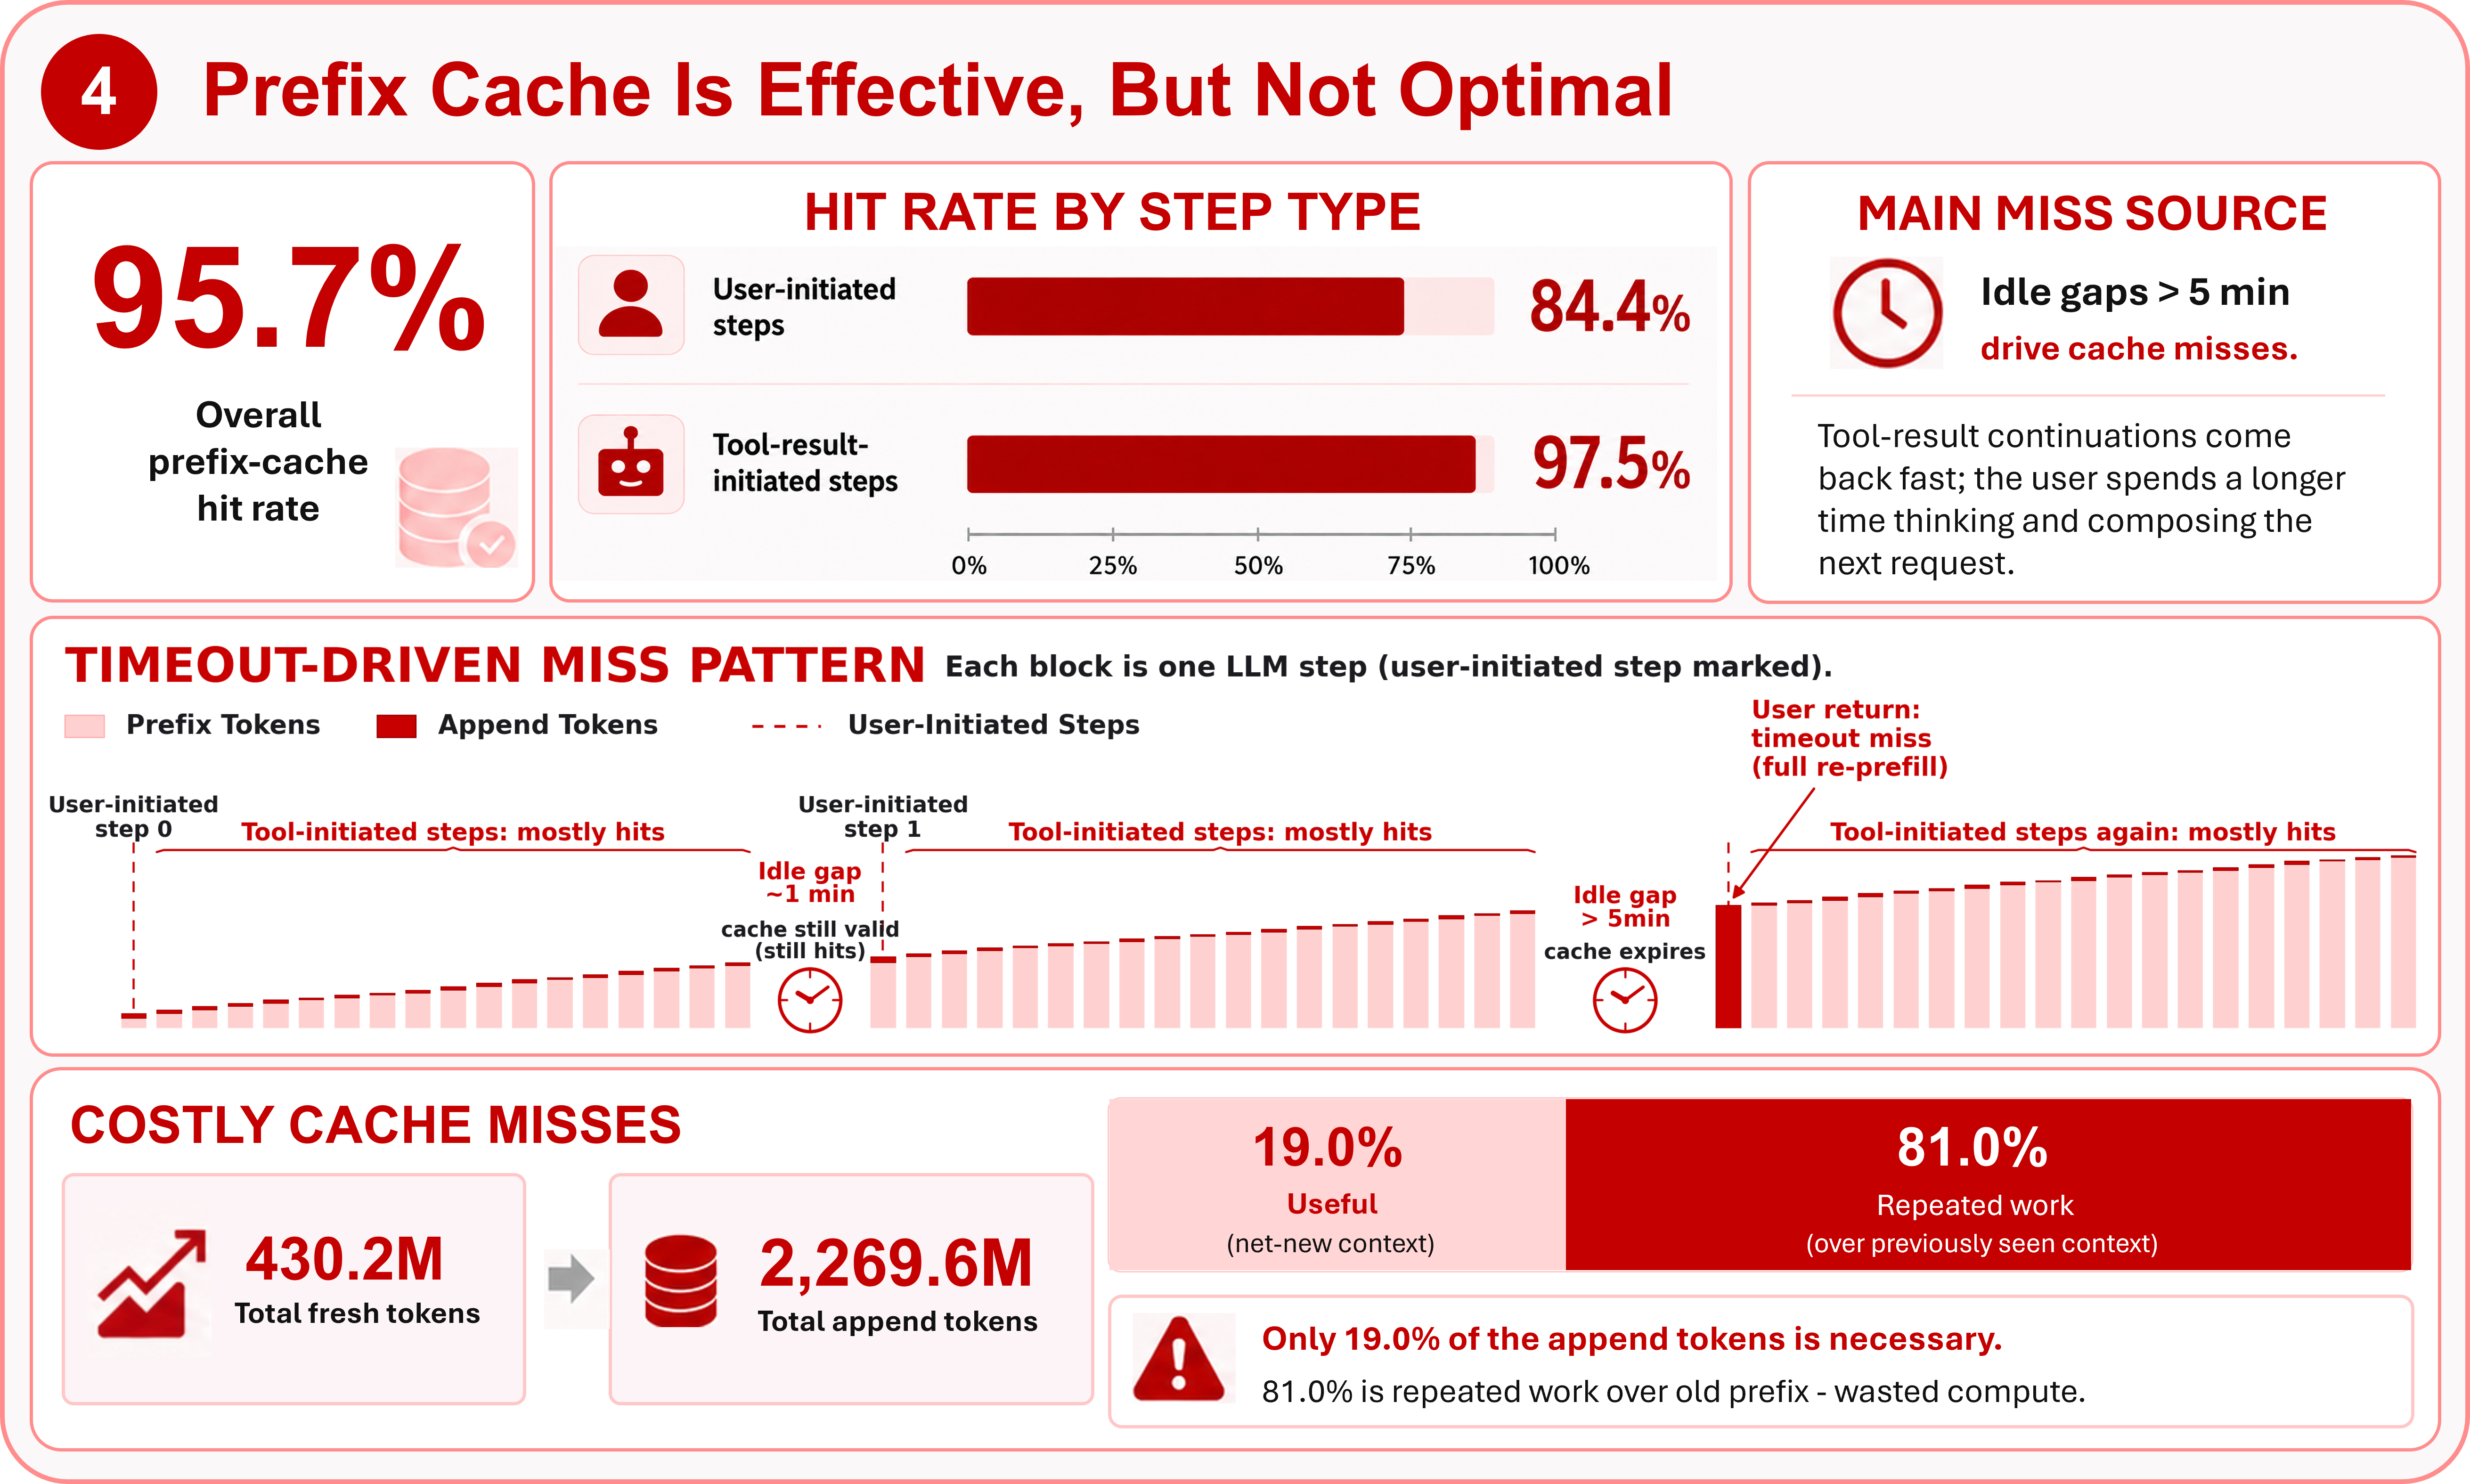
In aggregate, prefix caching looks great: 95.7% of input tokens hit the cache. That average, however, hides a sharp split between the two ways a step can start. Most steps are tool-result continuations—a tool call finishes and its result is immediately appended to the conversation and fed back to the model. These tool calls mostly have short latency, so they hit ~97.5%. Rounds that start from a new user message fare much worse, hitting only ~84.4%: prompt caches expire after a few minutes of inactivity, and users routinely pause longer than that between requests, so by the time the next request arrives, the context has aged out and must be re-prefilled from scratch.
The cost of prefix cache miss is substantial. Of the 2.3 B append tokens processed, only 19% represent genuinely new context; the other 81% is repeated work, re-prefilling tokens the system has already seen. Put differently, every new token is prefilled roughly 5× on average. Eliminating this redundancy would cut prefill compute for serving providers and shorten time-to-first-token for users.
Potential Research Directions.
- Investigation of the trade-off between KV-cache retention time and storage overhead: keeping entries alive across long user pauses saves re-prefill work but inflates memory and storage cost, and the break-even point likely varies with the model, hardware, and workload.
About our release
Our release bundles everything needed to reproduce this analysis and to build similar traces for your own usage:
- Trace examples. Side-by-side samples of raw Claude Code and Codex logs alongside our normalized, sanitized trace format.
- Collection pipeline. The trace collector and sanitizer that turn local Claude Code and Codex logs into clean, de-identified traces.
- Dataset and analysis scripts. The full anonymized trace together with the scripts that reproduce the results.
- Replay client. A client that reconstructs a similar request-arrival pattern to drive serving engines such as vLLM and SGLang.
Takeaways & next steps
This trace offers an early, concrete look at what real coding-agent traffic looks like to a serving system, highlighting the self-driven loop, the long-context, short-output nature, long-tailed tool calling, and a decent but not perfect prefix-cache hit rate. We admit this trace can be biased: the patterns reflect our particular projects and habits, which is exactly why we are releasing the full pipeline. If you use Claude Code, Codex, or any other coding agent, we’d love for you to visit https://tracelab.cs.washington.edu/, run the analysis on your own logs, share a sanitized trace if you’re comfortable, and help turn this first data point into a shared, community-built resource.
TraceLab is open source. If you build on this work, please cite it:
@misc{zhu2026tracelabcharacterizingcodingagent,
  title         = {TraceLab: Characterizing Coding Agent Workloads for LLM Serving},
  author        = {Kan Zhu and Mathew Jacob and Chenxi Ma and Yi Pan and Stephanie Wang and Arvind Krishnamurthy and Baris Kasikci},
  year          = {2026},
  eprint        = {2606.30560},
  archivePrefix = {arXiv},
  primaryClass  = {cs.LG},
  url           = {https://arxiv.org/abs/2606.30560}
}